


Understanding your customers is the first step to improving sales, boosting conversions, and scaling your eCommerce business. Thankfully, Shopify provides a wealth of data—and when combined with the right tools, you can gain deep, actionable insights into user behaviour, sales performance, and store optimisation opportunities.

In today’s post, we’ll show you how to set up analytics tools in your Shopify store, what data to focus on, and how to turn those insights into business growth.
📊 Why Data Analytics Matters for Shopify Stores
Whether you’re running a boutique fashion shop or a high-volume electronics store, data helps you:
- Understand how visitors interact with your site
- Identify what’s driving conversions (or causing drop-offs)
- Optimise marketing campaigns based on real ROI
- Track product performance and customer retention
- Make informed decisions rather than relying on guesswork
Data-driven decisions are the difference between growing a store—and just maintaining one.
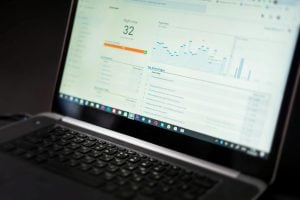
🔧 Step 1: Use Shopify’s Built-In Analytics Dashboard
Shopify includes a native analytics dashboard that gives you an overview of:
- Total sales
- Online store sessions
- Conversion rate
- Average order value
- Returning customer rate
- Top products and traffic sources

Where to find it:
Go to your Shopify Admin > Analytics > Dashboards
Limitations:
While it’s helpful for quick insights, Shopify’s built-in tools are more high-level and less customisable than third-party analytics platforms.
📈 Step 2: Integrate Google Analytics (GA4)
To get deeper behavioural insights, Google Analytics 4 (GA4) is essential.
How to Set Up GA4 in Shopify:
- Create a GA4 property via your Google Analytics account
- Go to Admin > Data Streams > Web and copy your Measurement ID
- In your Shopify admin, go to Online Store > Preferences
- Paste your Measurement ID under the Google Analytics section
- (Optional) Use Google Tag Manager for advanced tracking and event management
🛑 Note: GA4 does not support Universal Analytics (UA). Ensure you’re using the new GA4 setup.
📍 Step 3: Set Up Enhanced eCommerce Tracking
Enhanced eCommerce gives you access to deeper sales and funnel data, such as:
- Product impressions
- Add-to-cart actions
- Checkout behaviour
- Purchase performance
- Coupon usage
How to Enable:
If you’re using Google Tag Manager, implement GA4 eCommerce tags and triggers for actions like “begin_checkout”, “add_to_cart”, and “purchase”.
Or use an app like:
- Elevar
- Littledata
- Google Analytics & Facebook Pixel by Simprosys
These apps help bridge the gap between Shopify’s native checkout and GA4 tracking.
📱 Step 4: Monitor On-Site User Behaviour
Beyond just numbers, understanding how users interact visually with your store can uncover hidden UX issues.

Recommended Tools:
- Hotjar – Heatmaps, click tracking, and user session recordings
- Microsoft Clarity – Free alternative with scroll depth and rage click tracking
- Lucky Orange – Combines live chat, analytics, and visitor recordings
These tools show:
- Where users drop off
- What draws attention (or gets ignored)
- How mobile vs. desktop users behave differently
💡 Step 5: Track Sales Performance & Product Trends
Key Metrics to Monitor:
- Best-selling products: Focus marketing and upsell strategies around them
- Product return rate: Identify items with quality or sizing issues
- Sales by channel: Measure performance of Facebook, Google, email, etc.
- Customer lifetime value (CLV): Assess retention strategies
- Revenue per visitor (RPV): Understand what each visit is worth
Use Shopify reports or apps like:
- Lifetimely (for CLV and retention analytics)
- Better Reports (custom dashboards and product performance)
- Seguno (email ROI tracking)
📦 Bonus: Monitor Inventory & Operational KPIs
Analytics isn’t just for marketing—it also helps with operations.

Track:
- Inventory turnover rate
- Sell-through rate
- Fulfilment times
- Order error rates
Connect your store with reporting platforms like Google Data Studio, Klipfolio, or Power BI for end-to-end business intelligence.
🔁 Pro Tip: Automate Report Delivery

Set up automated reporting so that your team receives daily or weekly analytics summaries. Many tools allow scheduled email reports or Slack integrations.
✅ Final Thoughts
Tracking your Shopify store’s performance isn’t just about numbers—it’s about unlocking insights that drive action. With the right analytics stack in place, you’ll understand what’s working, what needs fixing, and where your greatest opportunities lie.