


Introduction
Debugging is the most time-consuming and anxiety-inducing step in software development. In large-scale systems, finding and fixing bugs can take days or weeks—delaying releases and frustrating teams.
But what if artificial intelligence could act as your debugging assistant? In 2025 and beyond, AI-powered tools are transforming the debugging process: identifying errors instantly, pinpointing root causes, suggesting fixes, even generating patches automatically. These smart debugging techniques reduce downtime, improve code quality, and free developers to focus on building new features.
In this guide, you’ll learn how AI-powered debugging works, the tools leading the charge, real-world use cases, limitations, and a practical roadmap to adopting smart debugging in your development lifecycle.
1. Why Debugging Remains Painful
1.1. Root Cause Analysis Is Hard
Tracing failures across microservices, threaded code, or async flows requires tracing logs, stack traces, error messages, and often guesswork.
1.2. Distributed Systems Add Complexity
In modern architectures, bugs can propagate across services, queues, versions, or integrations—making traditional print() debugging ineffective.
1.3. Time Investment
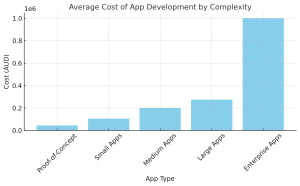
Studies show developers spend 30–40% of time on debugging and defect-fixing—effort that scales sharply with app complexity.
1.4. Reproducing Bugs Is Tricky
Non-deterministic failures—like race conditions or environment-specific edge cases—can be very hard to replicate locally.

2. How AI Enhances Debugging: A Technical Framework
2.1. Log and Trace Analysis with ML
AI ingests logs, error messages, stack traces, and correlates them to identify:
- Common failure patterns
- Sequence anomalies in service calls
- Similarities with past incidents
This exposes likely root causes or suspects in seconds.
2.2. Anomaly Detection
Unsupervised learning techniques (e.g., autoencoders) detect unusual behavior in metrics or log volume—calling attention to unreported or emerging bugs.
2.3. Stack Trace Classification & Bug Clustering
AI models learn to cluster similar crash traces across builds, flagging recurring issues and prioritizing high-frequency bugs for triage.
2.4. Automated Fix Suggestions
By analyzing code changes and historical bug-fix patterns, AI models—particularly fine-tuned LLMs—can suggest code patches or refactorings.
2.5. Explaining Diagnostic Results
Explainable AI helps surface why a bug is suspected (e.g., “loop termination condition missing,” “off‑by‑one error in boundary check”)—enhancing trust and transparency.
3. Core Components of Smart Debugging Platforms
| Area | What AI Does |
|---|---|
| Log ingestion | Aggregates and structures logs from multiple services |
| Trace correlation | Builds call maps and traces causal sequences |
| Anomaly detection | Flags performance regressions and error spikes |
| Bug clustering | Groups similar error events across environments |
| Patch generation | Proposes code fixes based on learned patterns |
| CI/CD integration | Auto-triggers fixes and tests during pipelines |
| Knowledge base suggestions | Matches new errors to known solutions |
These tools often integrate with source control (Git), issue tracking (Jira), IDEs (VS Code), and incident platforms (PagerDuty, Opsgenie).
4. Leading AI Debugging Tools and Capabilities (2025)
4.1. DeepCode (now Snyk Code)
- Analyzes pull requests for common bug patterns.
- Suggests fixes and shows matching code snippets from open source and past fixes.
4.2. GitHub Copilot for Diagnostics
- Suggests patches or error fixes in real time within VS Code.
- Context-aware: understands code, errors, and repository history.
4.3. LinearB + DeepSeq
- Uses ML to highlight at-risk files, duplicate bugs, and areas of high churn or complexity.
4.4. Dynatrace Davis
- Automatic root cause analysis using AI on metrics, logs, and traces.
- Suggests code-level hotspots needing attention.
4.5. Codeium / Qodo (TestGPT)
- Auto-generates unit tests or patches based on errors found in CI.
- Works in tandem with code review tools to minimize manual edits.
4.6. Rollbar’s Error AI
- Classifies new errors, groups them, and surfaces the most disruptive issues.
- Triggers chatbot-like summarization and remediation guidance.

5. Real-World Use Cases
5.1. Crash Triage at Scale
A mobile app crashes on thousands of devices with varying stack traces. AI clusters these crashes and identifies a faulty API deserialization condition. The development team fixes the root cause before client support tickets spike.
5.2. Performance Regression Identification
After a release, response times for a key endpoint spike. AI detects the latency change, correlates it with a recent database query change, and points developers to the misconfigured ORM layer that introduced full-table scans.
5.3. Automated Patch Creation
In a financial application, an exception (“Divide by zero”) is raised by edge-case inputs. Copilot suggests a guard clause fix. Developers review, accept, and merge the patch within minutes—even while the app is live.
5.4. Incident Prevention
AI monitors system metrics—when memory usage suddenly increases in one service, anomaly detection predicts a potential memory leak. A patched version is deployed before users are affected.
6. How Smart Debugging Fits in Your Tech Stack
6.1. CI/CD
Automated bug detection can be run on every build. If the AI flags high-severity issues, the pipeline can pause or require manual approval.
6.2. Logging Infrastructure
Converge logs via tools like Elastic Stack, Splunk, or a hosted observability platform. AI models rely on structured logs for accurate detection.
6.3. Error Tracking
Integrate with error platforms like Sentry or Rollbar. AI enhancements provide context and remediation paths faster than manual triage.
6.4. Code Analysis Tools
Static analysis via DeepCode or SonarQube is enriched with AI bug detection for runtime or logic issues.
6.5. IDE Plugins
VS Code or JetBrains plugins highlight potential bugs or fix suggestions inline—reducing context switching.
7. Steps to Implement AI Debugging in Your Organization
Step 1: Define Objectives
Clarify target areas:
- Reduce time to triage
- Avoid regressions
- Detect high-risk bugs early
Step 2: Pilot One Component
Start with a critical microservice or module where logs and code are well-instrumented.
Step 3: Instrument Logging and Tracing
Ensure clear error messages, structured logs, and distributed tracing.
Step 4: Activate AI Triage
Enable clustering and root cause suggestions. Examine the top 20 recurring bugs for accuracy.
Step 5: Enable Patch Suggestions
Allow Copilot or DeepCode to propose fixes. Pair developers to review.
Step 6: Integrate Into CI/CD
Set guardrails—for example, pause auto-deployment if critical AI-identified bugs are found.

Step 7: Measure Impact
Key metrics:
- Mean Time To Resolution (MTTR)
- Regression failure rate
- Time saved by developers
Step 8: Refine and Expand
As accuracy improves, roll the solution across teams or services.
8. Pros and Cons of AI-Powered Debugging
✅ Pros
- Faster and more accurate error detection
- Reduced developer frustration
- Increased trust in QA/CI pipeline
- Scalable insights across large codebases
⚠️ Cons
- Can suggest incorrect or unsafe fixes
- May not diagnose highly domain-specific logic errors
- Privacy and IP considerations when logs or code go to SaaS tools
- Requires initial effort to instrument logging and tracing
9. Ensuring Responsible Use of AI Debugging
- Keep human-in-the-loop for gap validation and risk control.
- Maintain voice of developer reviews before deploying auto-patches.
- Preserve audit trails (who approved, when, what change).
- Store logs and error data securely to meet GDPR/industry standards.
10. The Future of Smart Debugging
- Multi-agent systems that isolate symptoms, propose fixes, test, and even roll out patches autonomously.
- Self-healing services that detect error patterns in production and auto-scale or restart gracefully without human intervention.
- Proactive bug prevention by analyzing code changes and alerting about potential downstream issues before builds.
- AI-based code smell remediation to stop code rot and technical debt early.
Conclusion
Smart debugging tools powered by AI are dramatically changing how we find and fix software bugs. By mining logs, analyzing crashes, clustering errors, and even suggesting code fixes, AI turbocharges what used to be a labor-intensive and error-prone process.
To adopt smart debugging:
- Identify high-impact bug types or services.
- Implement structured logging and tracing.
- Pilot with an AI diagnostic tool.
- Measure improvements (MTTR, regression prevention).
- Combine AI insights with human oversight.

The result? A leaner, smarter QA pipeline, faster releases, and happier engineers. The era of AI-augmented debugging is here. Are you ready?
Related FAQs
Q1: Can AI debugging replace human developers?
No. It enhances developer ability, but human oversight is essential—for logic validation and safety.
Q2: How accurate are AI fix suggestions?
Accuracy varies. Most tools reach around 70–80% valid suggestion rates depending on context.
Q3: Do I need to share private code with SaaS AI tools?
Often yes. For sensitive systems, use on-premise or encrypted solutions.
Q4: Which languages do these tools support?
Common languages: Python, Java, JavaScript, C#, Go. Support varies—check each tool.
Q5: Will smart debugging work for legacy code?
Partially. Works best in codebases with clean logs, test coverage, and structured error handling.